
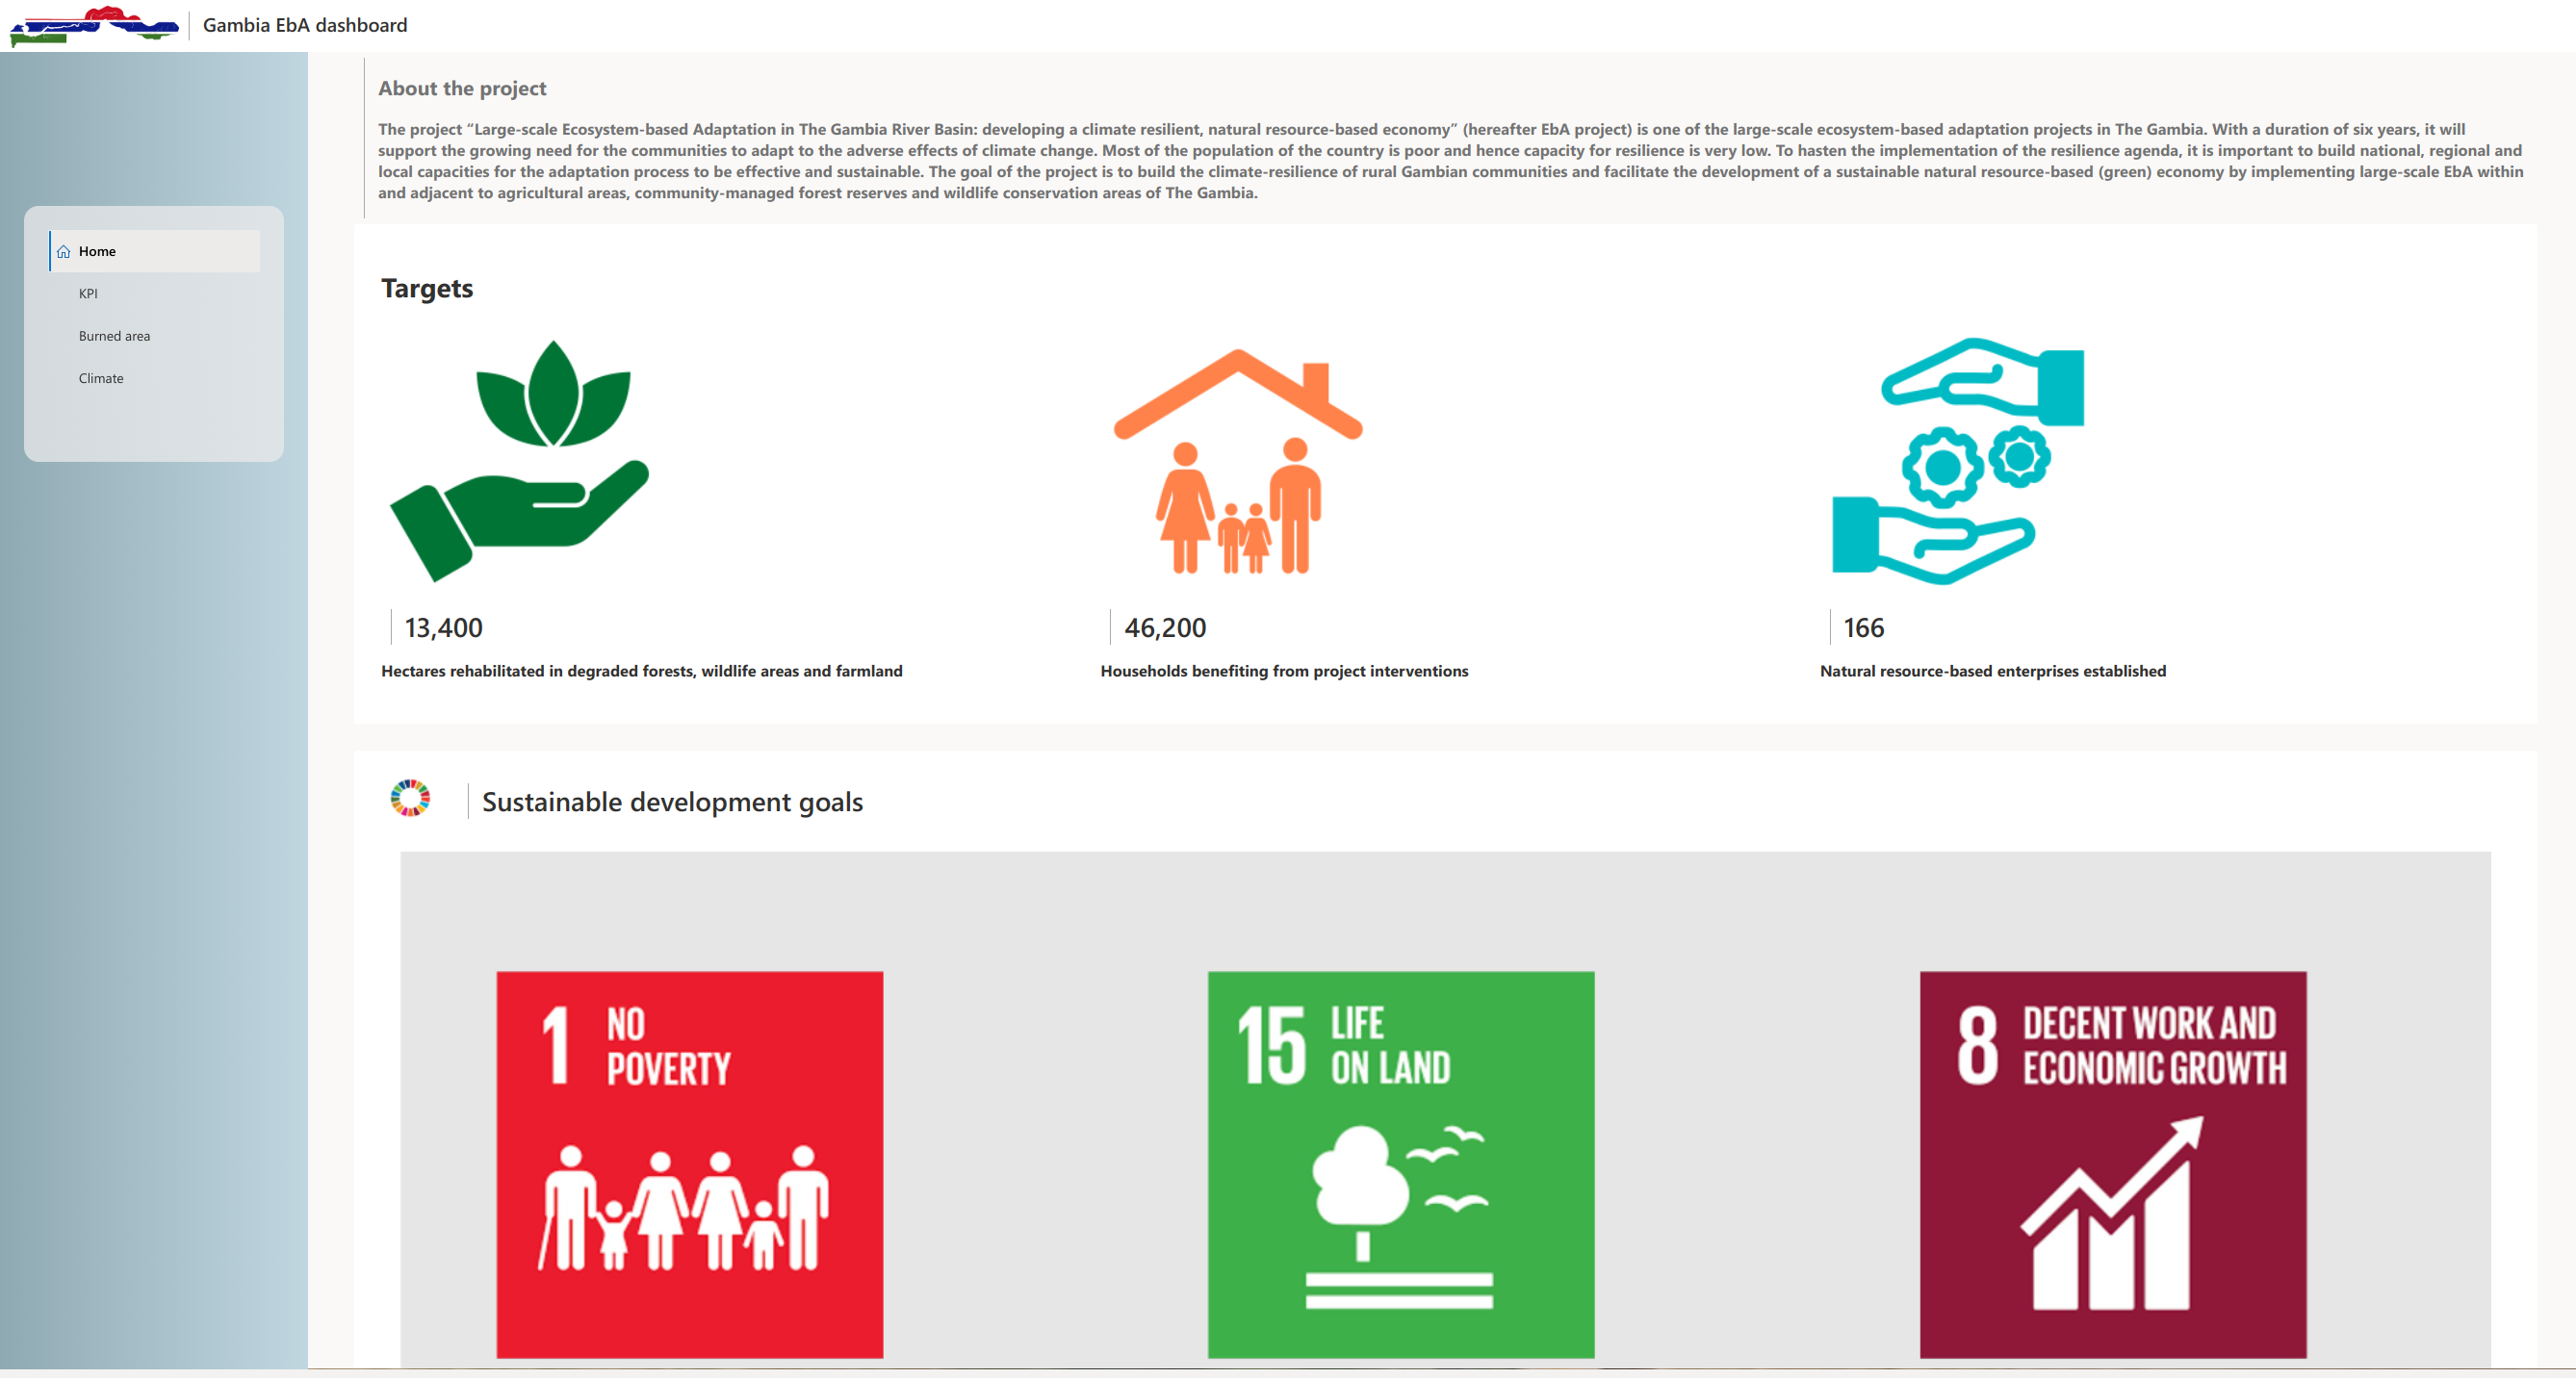
Earth Observation Assisted Assessment and Monitoring of Ecosystem Health in Kenya
Data and evidence to strengthen baseline assessments, inform interventions and monitor impacts across landscapes

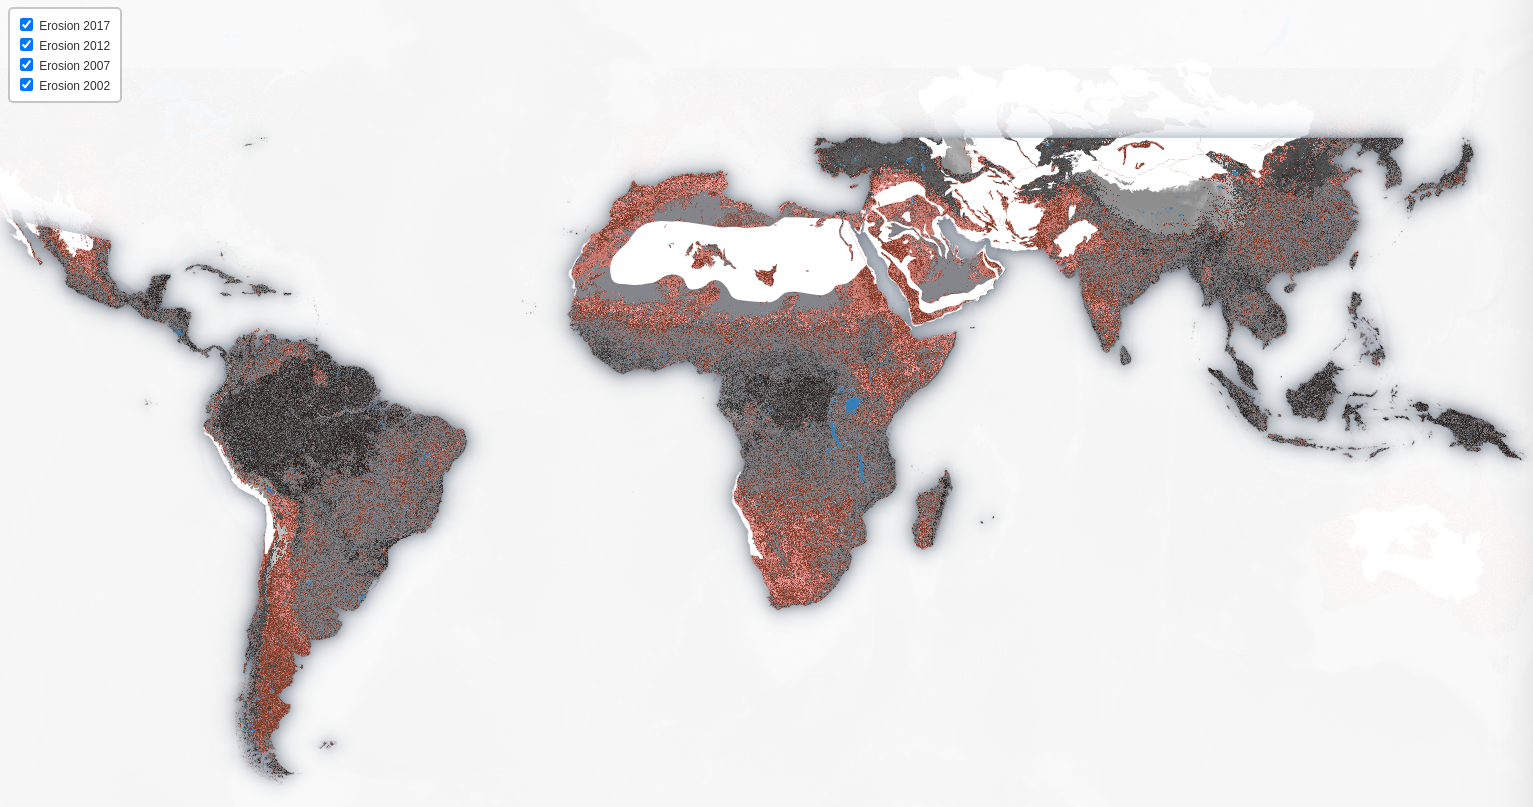
Global Soil Erosion.
This online app was developed to allow you to interactively explore the maps produced as part of the paper 'Predicting the Spatial Distribution and Severity of Soil Erosion in the Global'
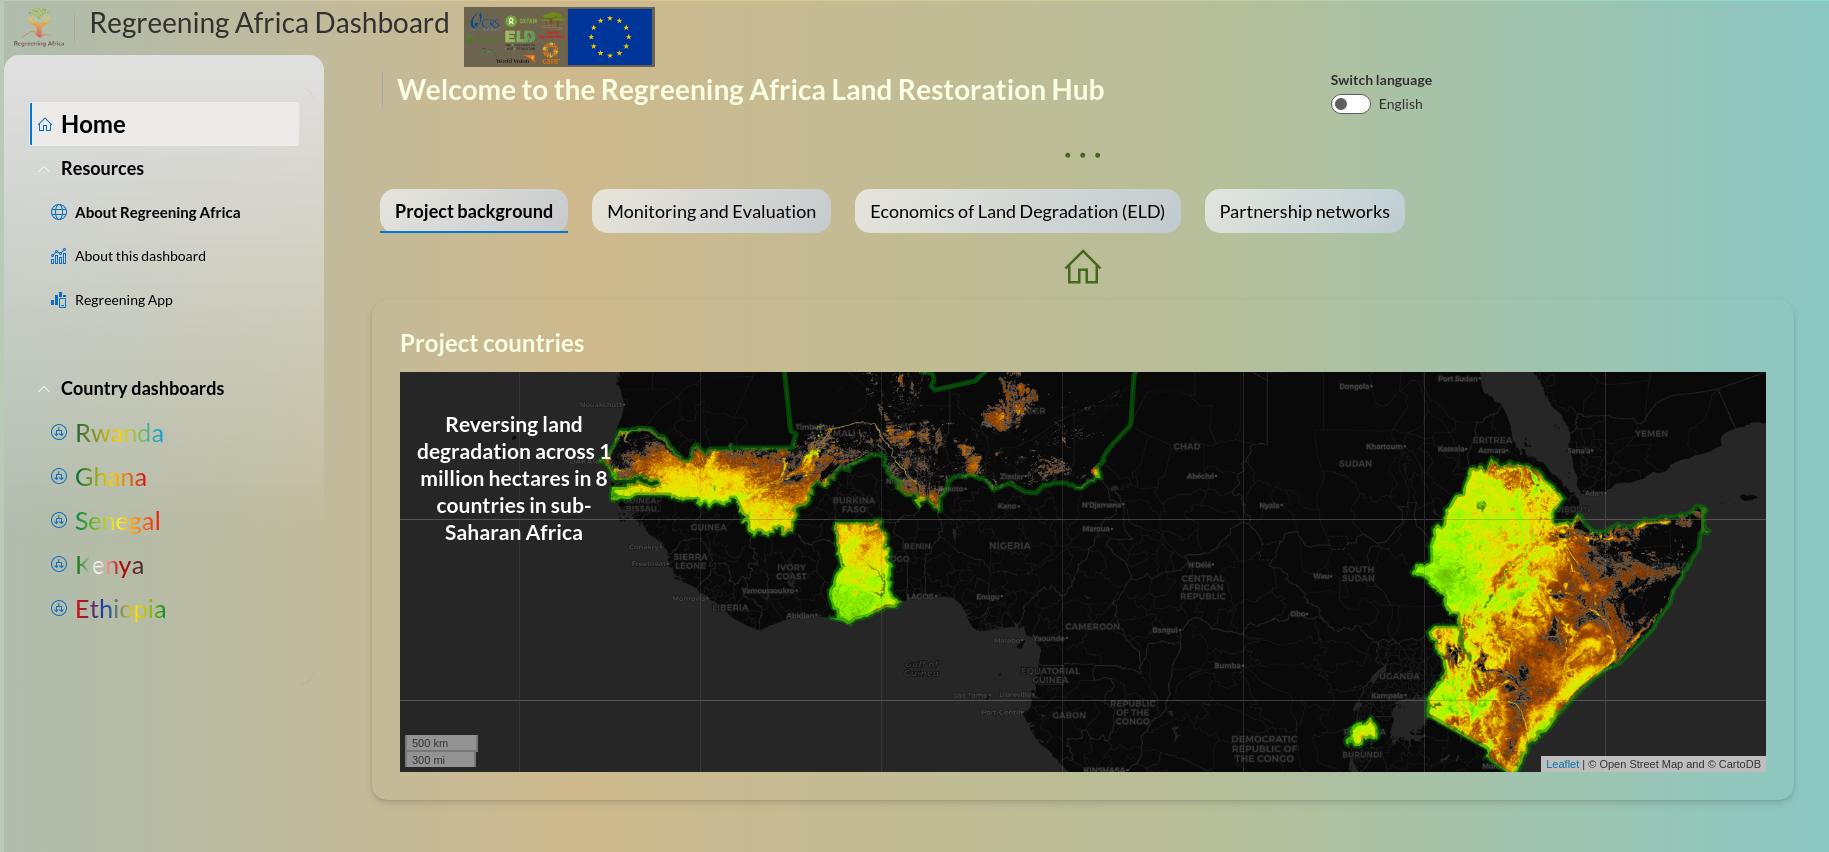
Regreening Africa decision dashboard.
Regreening Africa aims to reverse land degradation on 1 million hectares across 8 countries in sub-Saharan Africa.
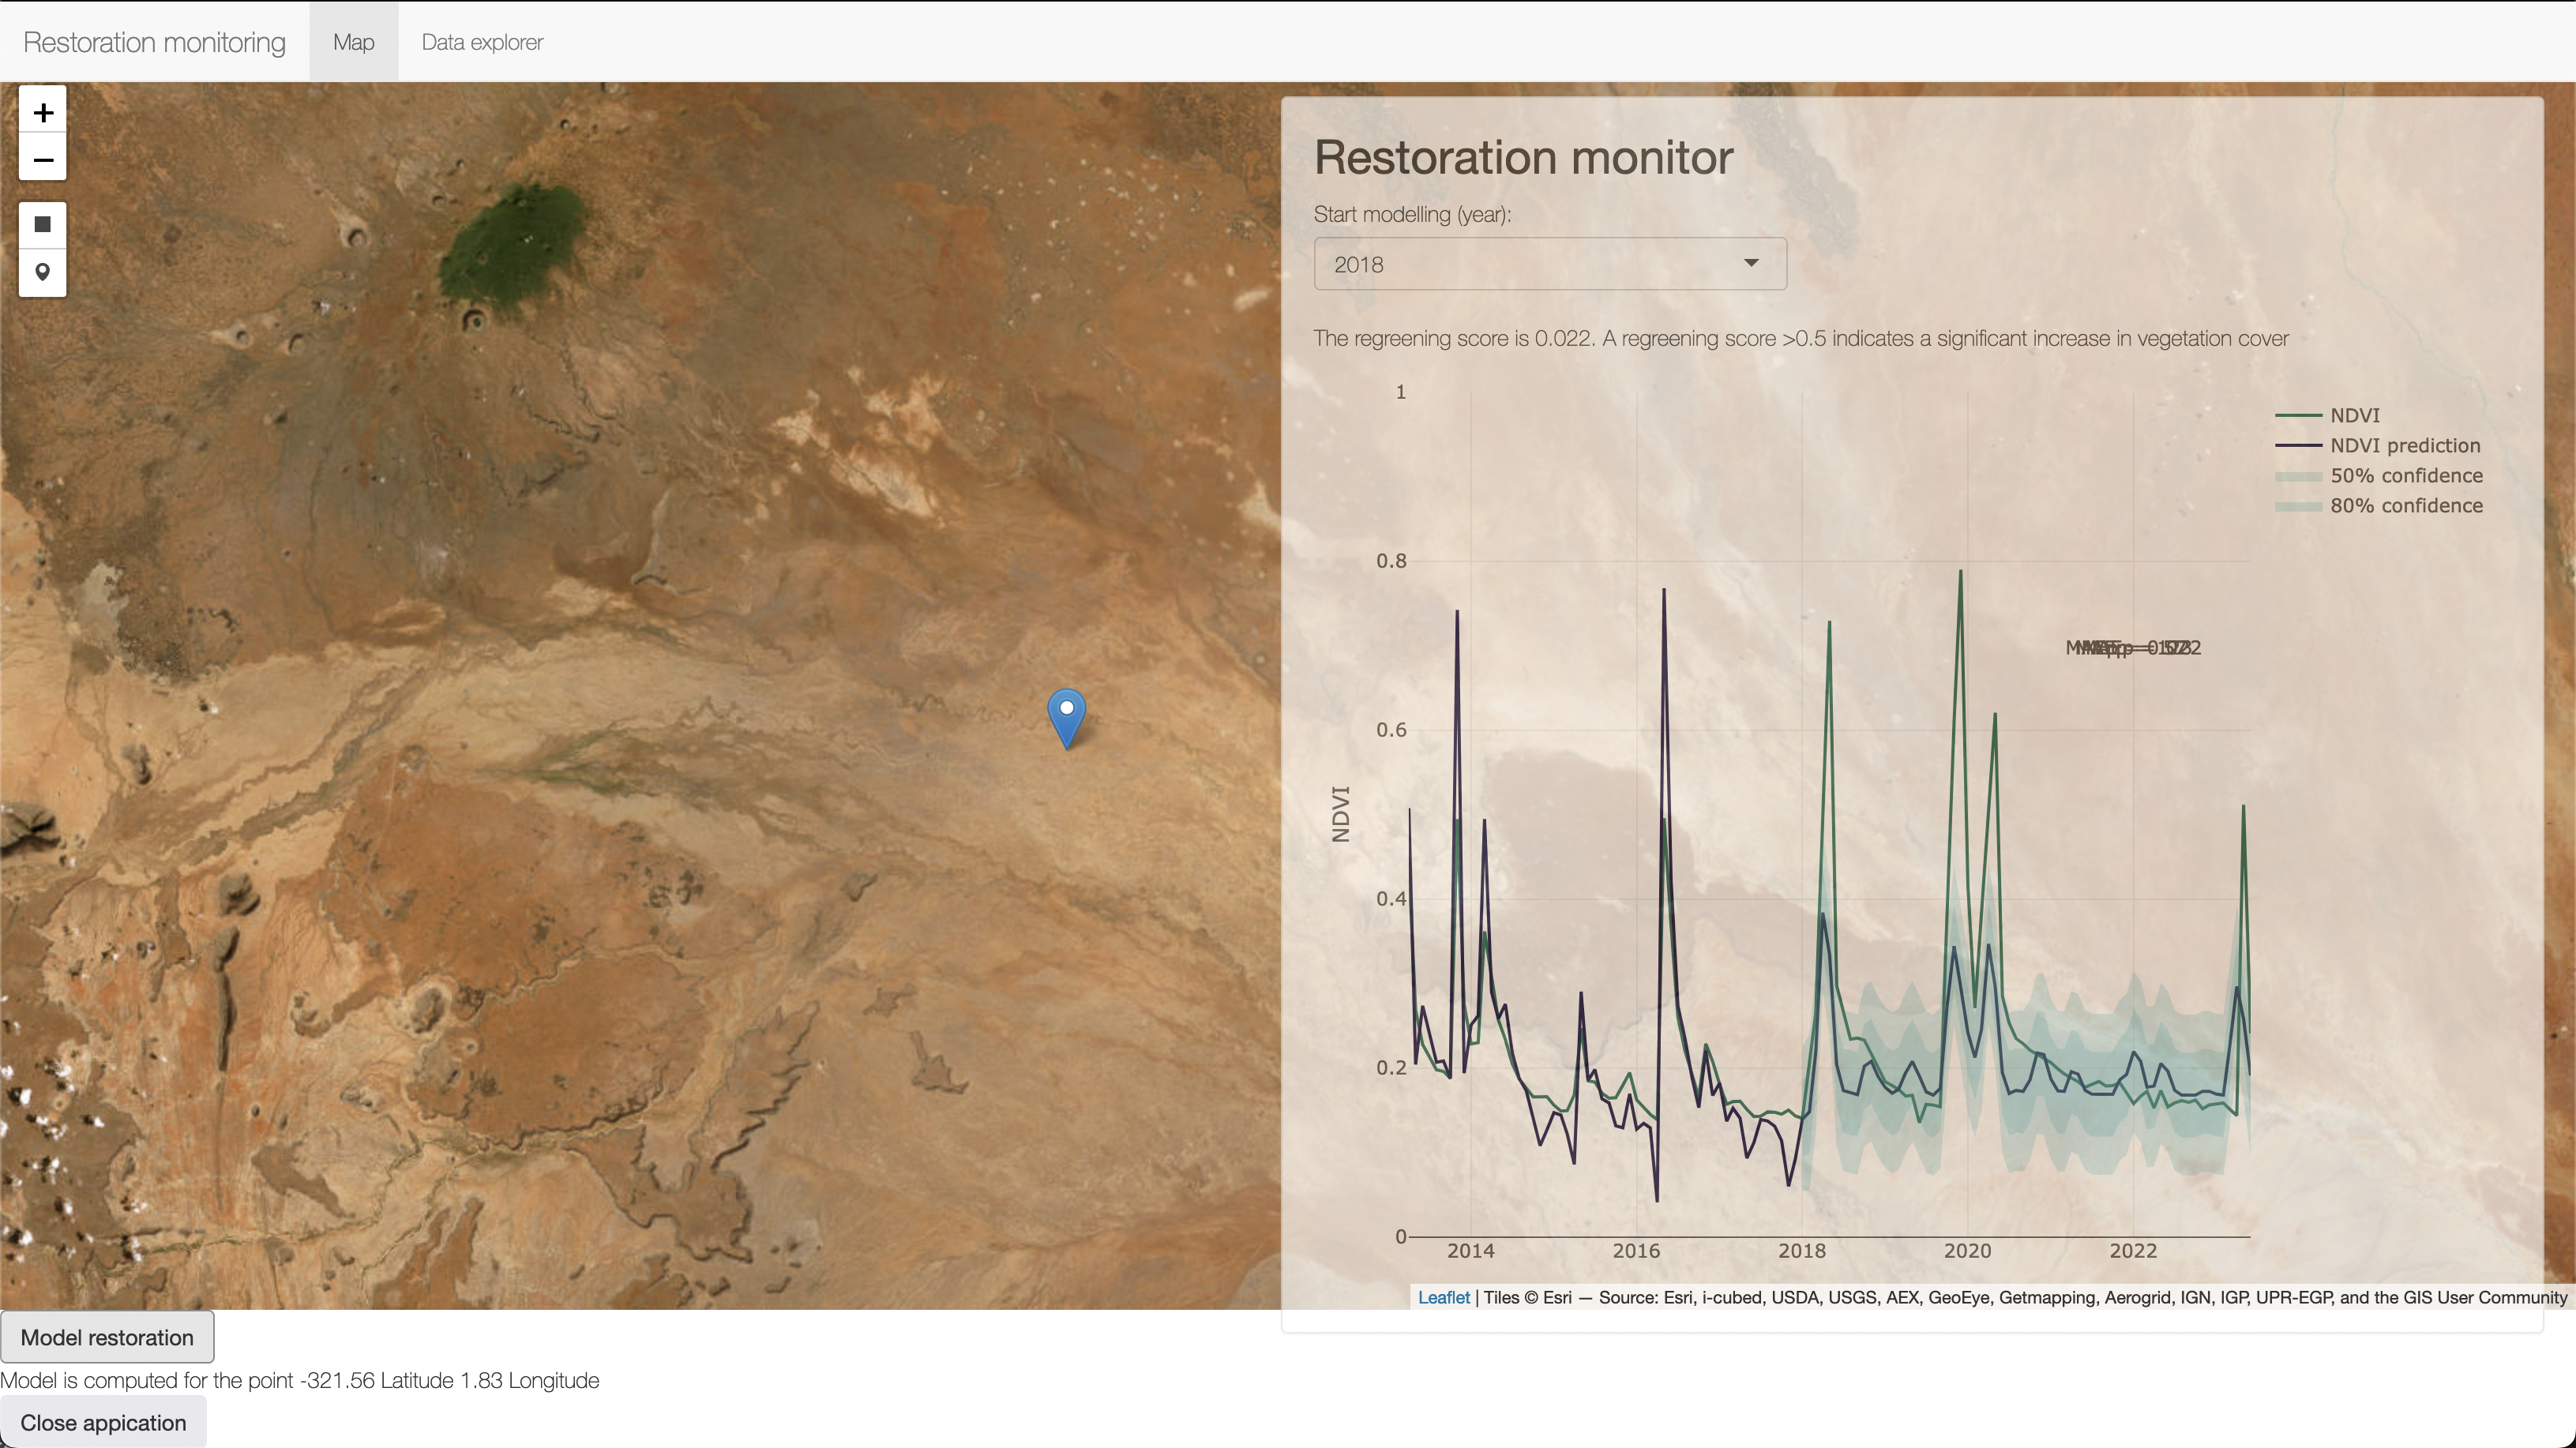
Restoration Monitoring App
An interactive tool with global coverage to model land restoration performance by combining machine learning and the latest satellite imagery.
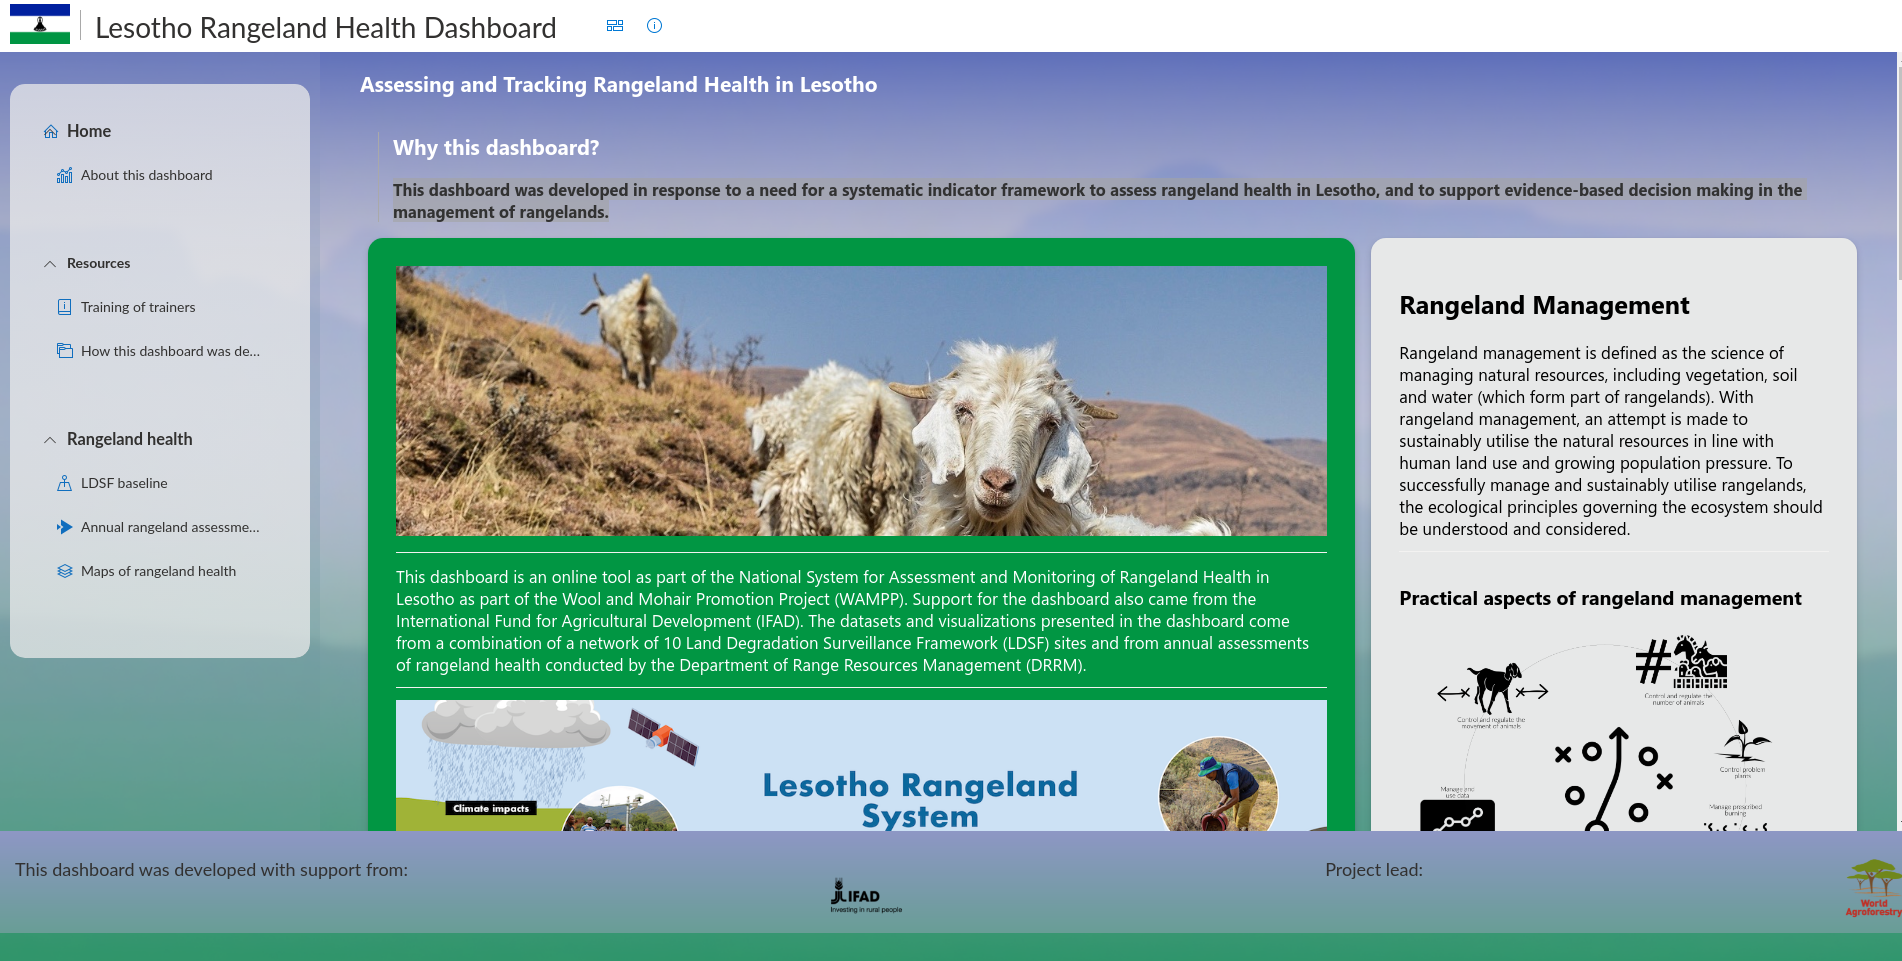
Lesotho Rangeland Health Dashboard
This dashboard was developed in response to a need for a systematic indicator framework to assess rangeland health in Lesotho, and to support evidence-based decision making in the mmanagement of rangelands.
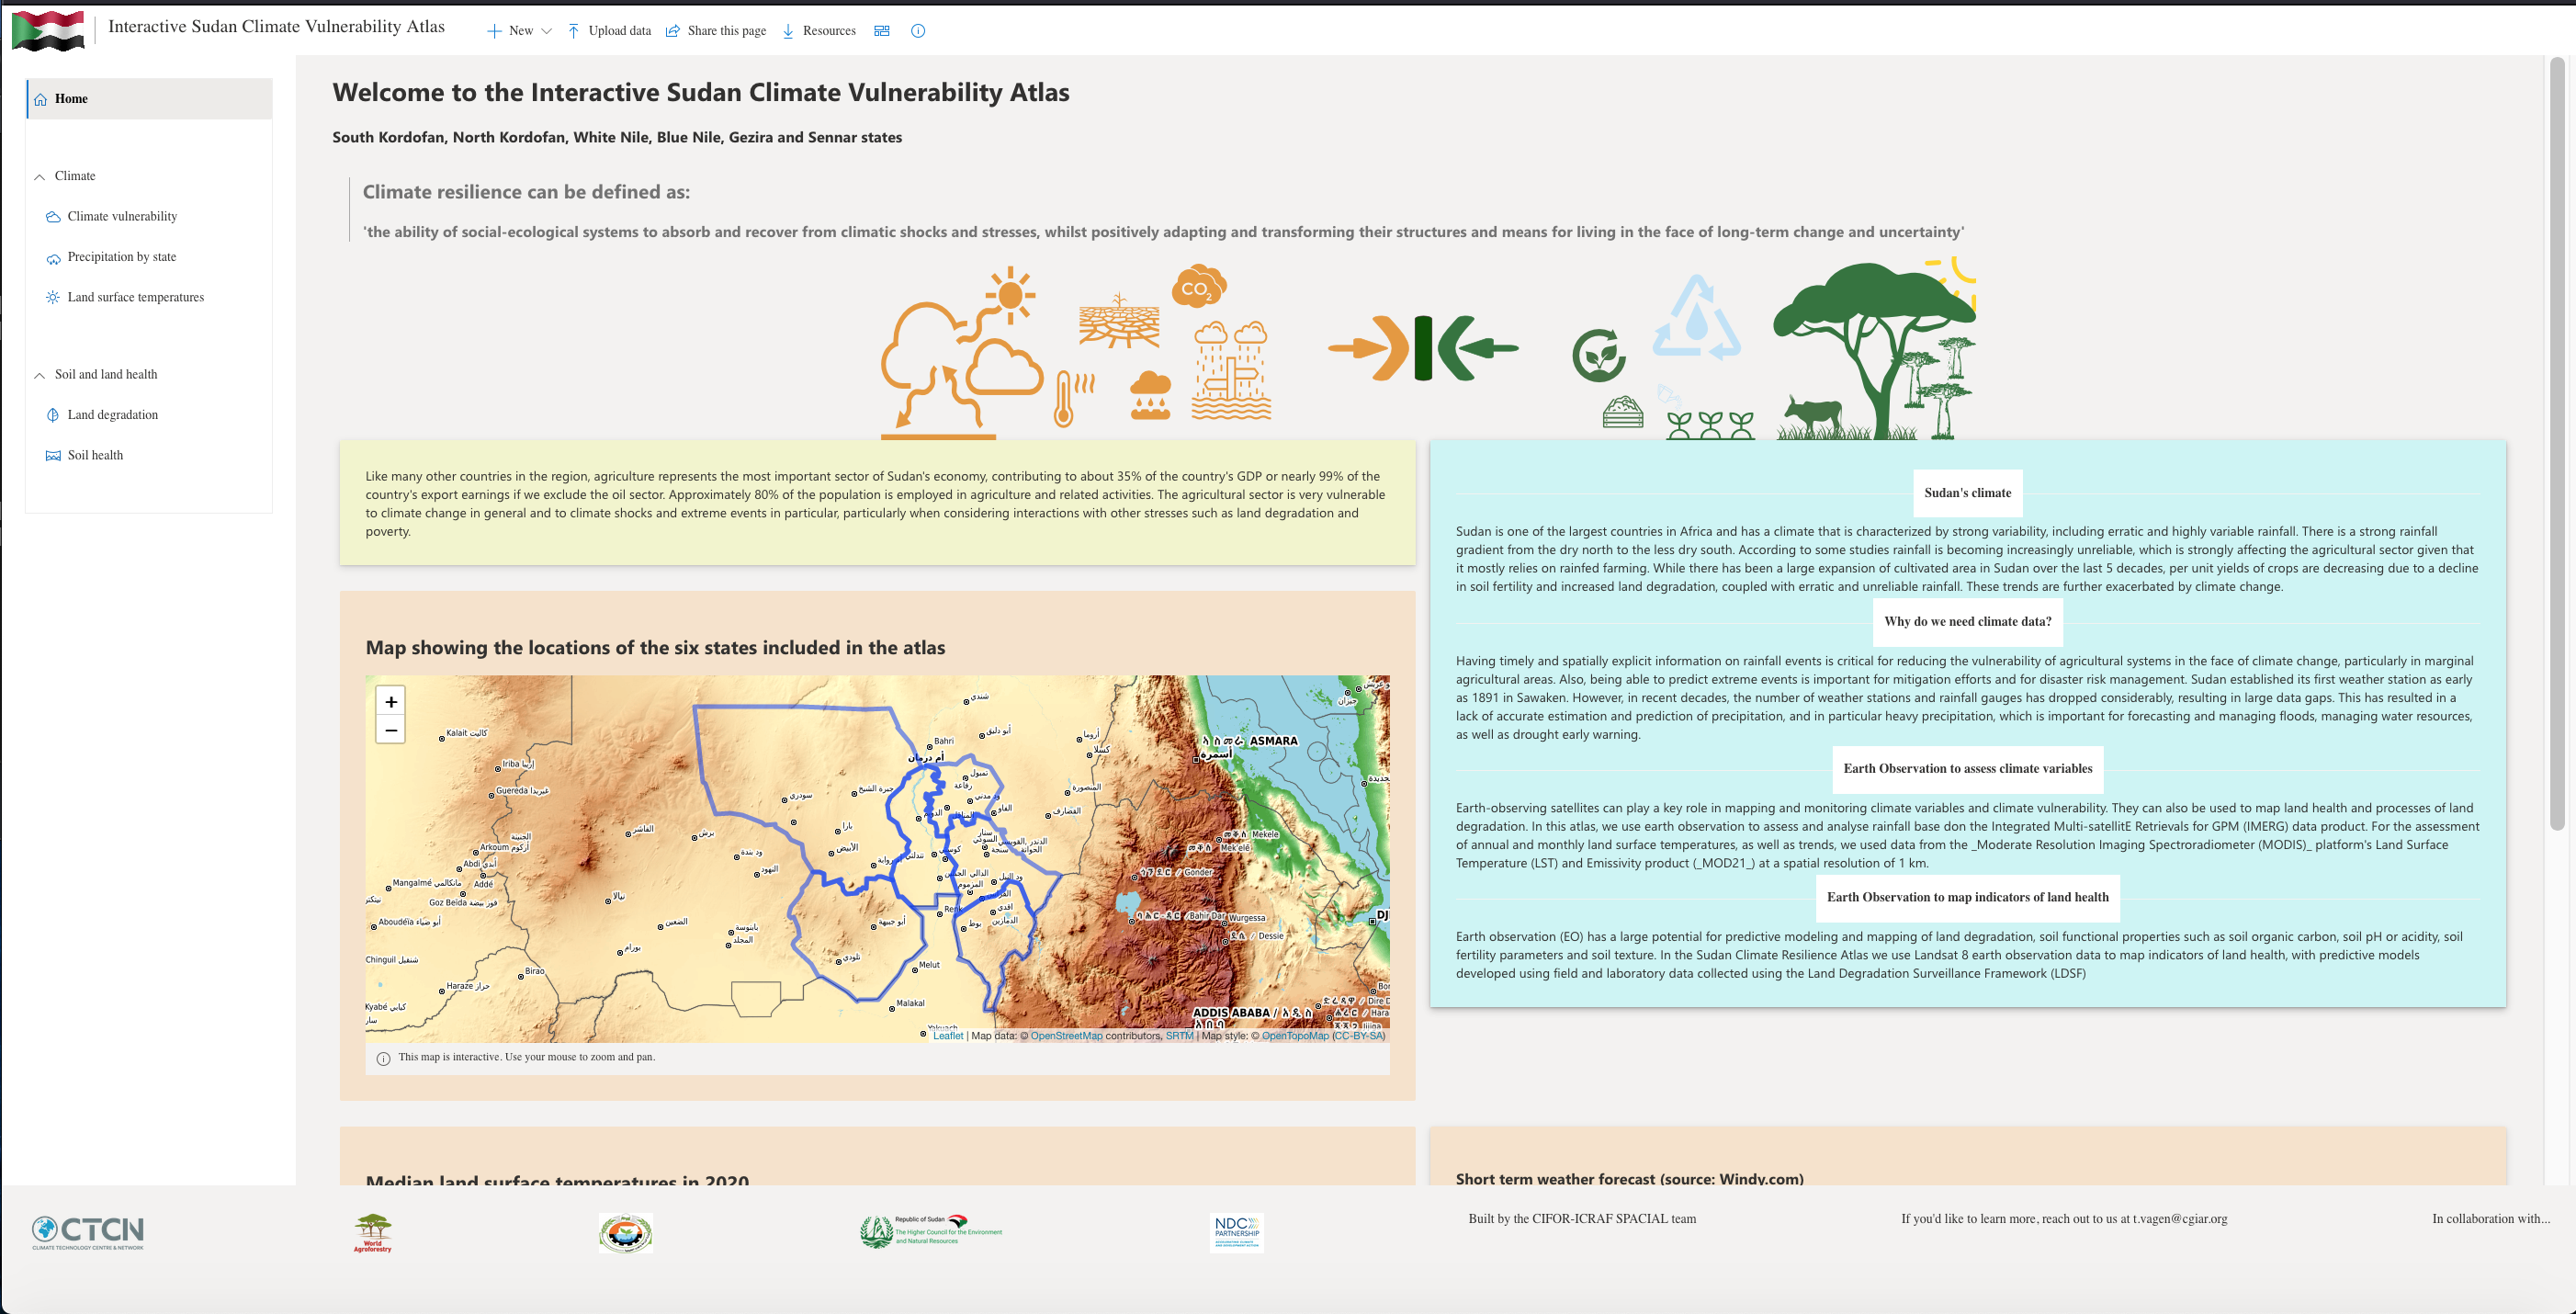
Interactive Sudan Climate Vulnerability Atlas
This dashboard seeks to provide timely and spatially explicit climate related data to help curb vulnerability of agricultural systems in the face of climate change in Sudan
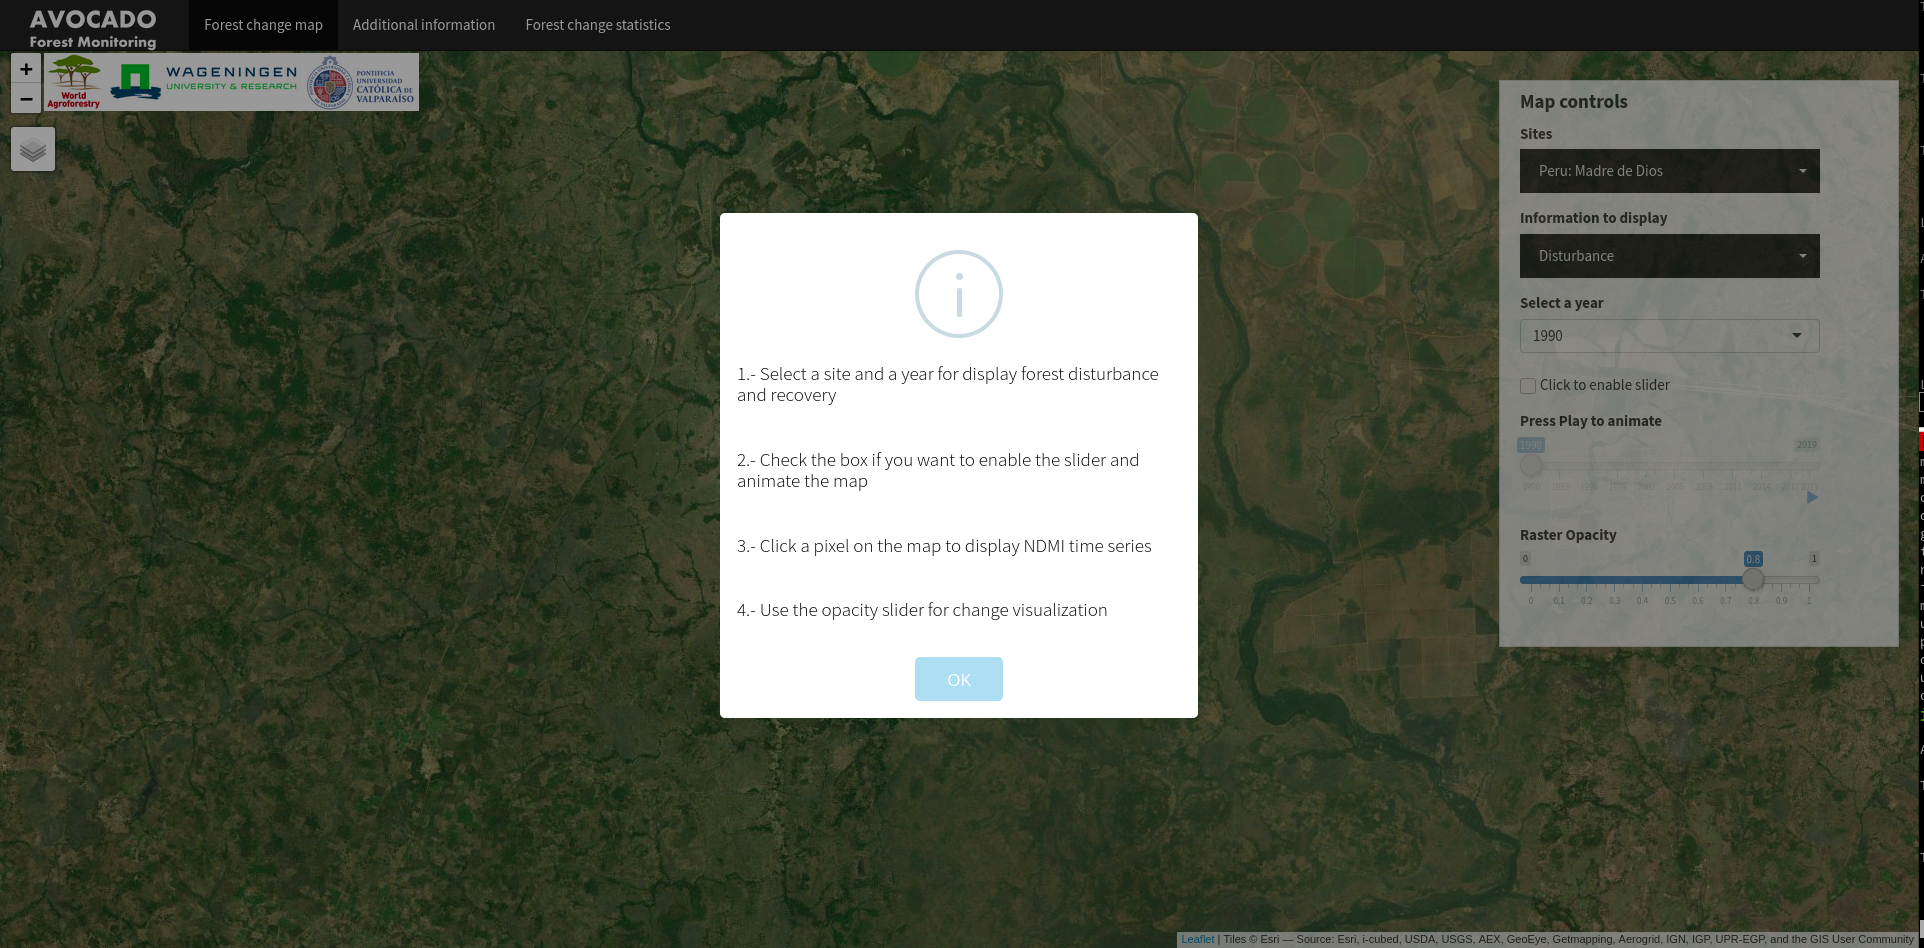
AVOCADO - (Anomaly Vegetation Change Detection)
The continuous forest disturbance and regrowth monitoring AVOCADO algorithm is based on a non-parametric test and makes use of the flexibility of kernel density estimations. The kernel density estimation in the vegetation index time-space works by centering a bivariate kernel around each observation and by averaging the heights of all kernels until obtaining the final density estimation.

Agroforestry and Land Health in Malawi Dashboard
This dashboard brings data and information into a dynamic central location and can be used to monitor and track land degradation, land health status and agroforestry systems, to allow for evidence based planning and decision making.

CGIAR research program on Forests, Trees and Agroforestry (FTA) Dashboard
The Sentinel Landscapes (SL) initiative is comprised of geographic areas or sets of areas with a broad range of biophysical, social, economic and political conditions. A core component of the SL network is a set of Land Degradation Surveillance Framework (LDSF) sentinel sites, where intensive data collection is taking place using co-located biophysical and socio-economic surveys in order to collect information on a number of social-ecological indicators.
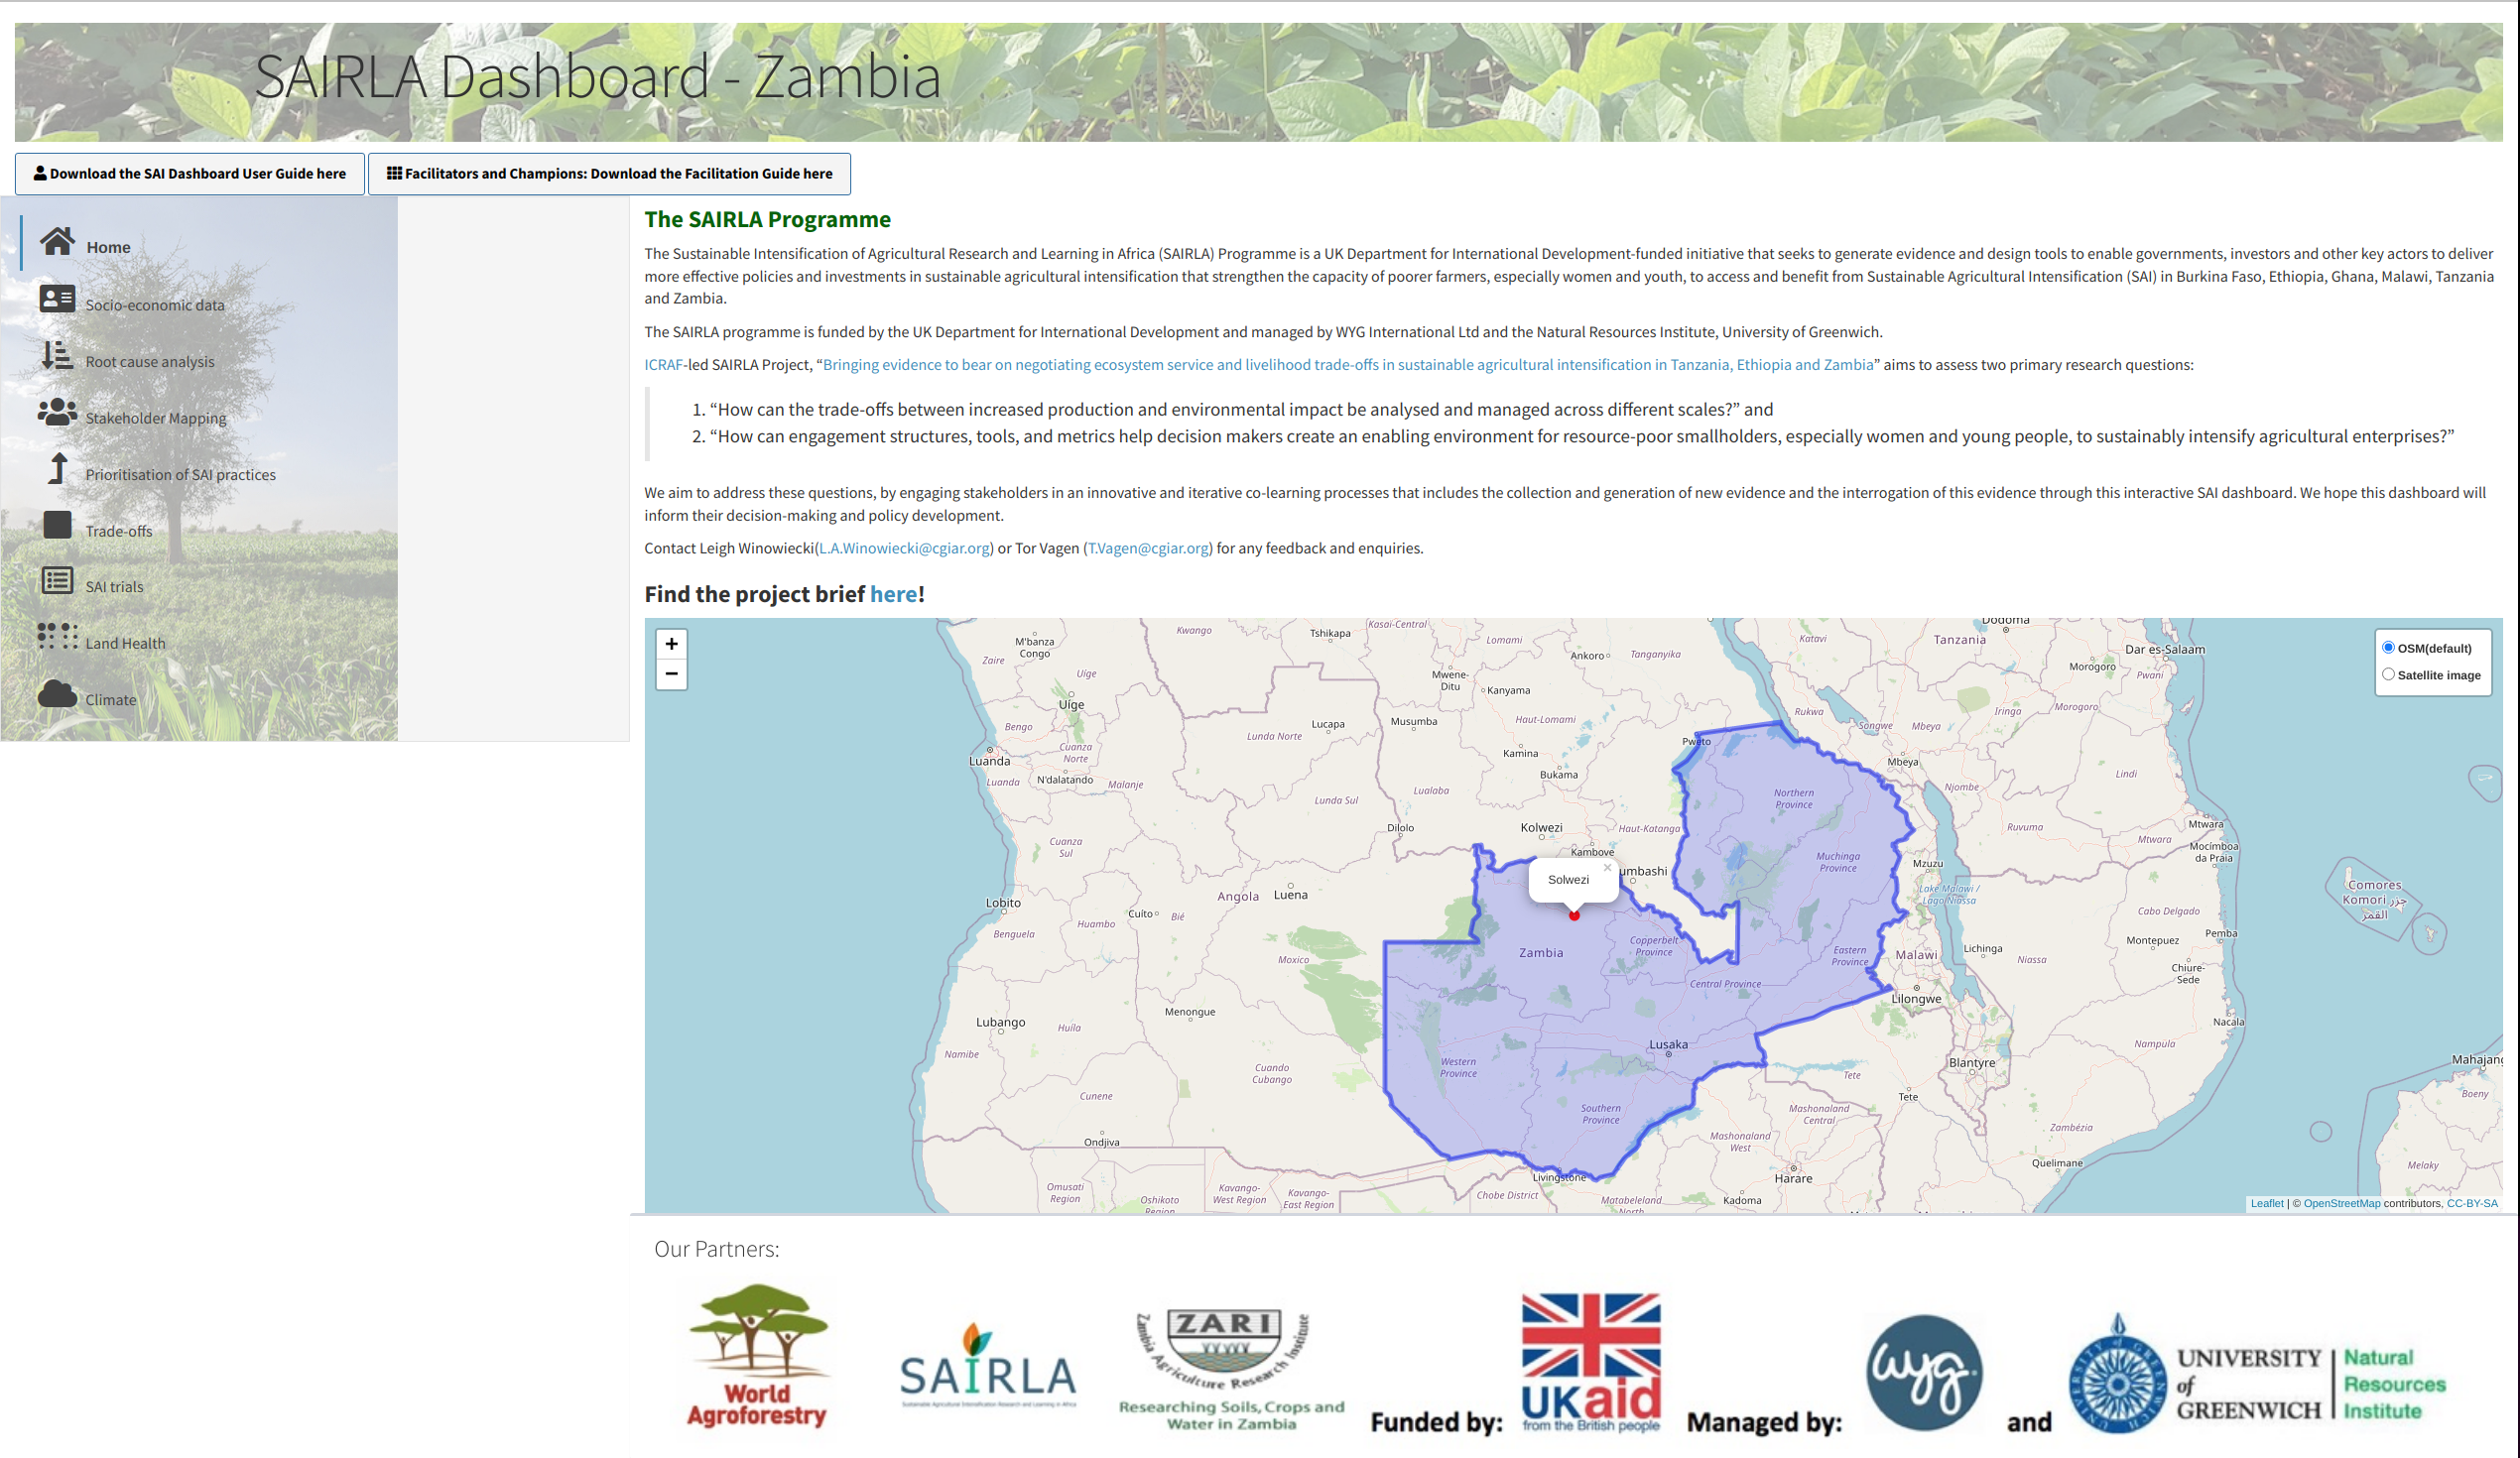
SAIRLA Zambia dashboard
Interactive SAi (Sustainable Agricultural Intensification) dashboard for Zambia developed under the Sustainable Intensification of Agricultural Research and Learning in Africa program. The project seeks to generate evidence and design tools to enable governments, investors and other key actors to deliver more effective policies and investments in sustainable agricultural intensification that strengthen the capacity of poorer farmers, especially women and youth, to access and benefit from SAI in Burkina Faso, Ethiopia, Ghana, Malawi, Tanzania and Zambia.
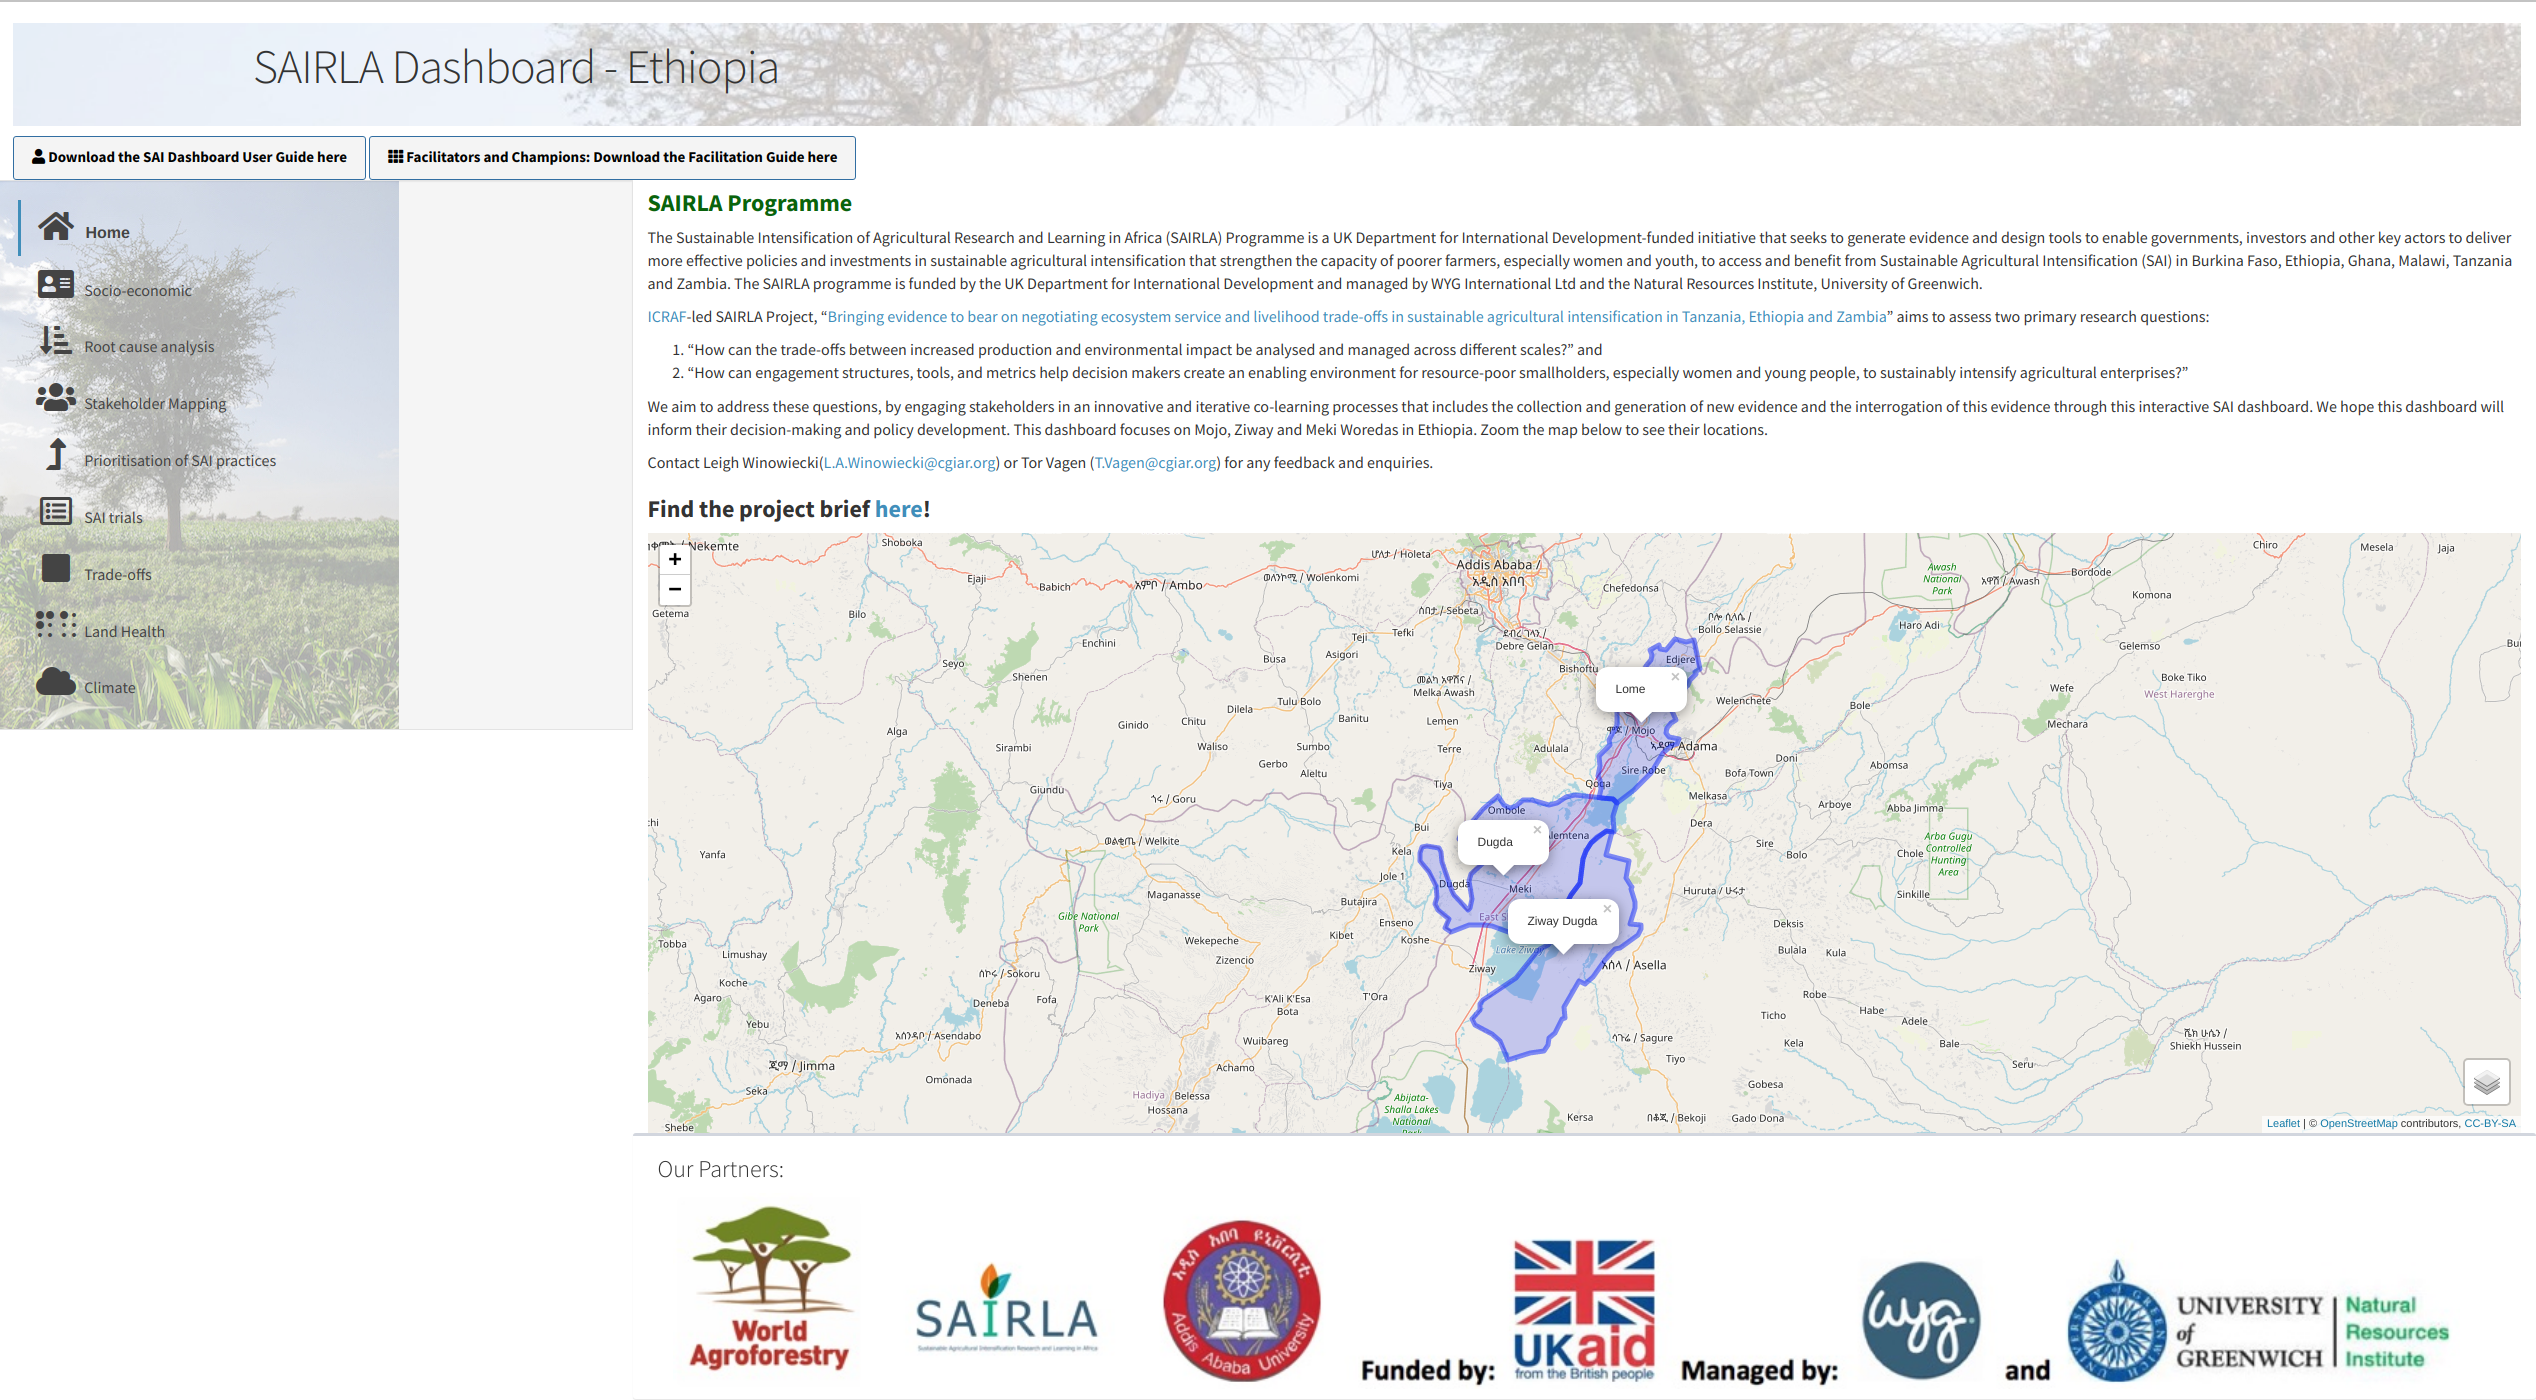
SAIRLA Ethiopia dashboard
Interactive SAI (Sustainable Agricultural Intensification) dashboard for Ethiopia developed under the Sustainable Intensification of Agriculture Research and Learning in Africa program. The project seeks to generate evidence and design tools to enable governments, investors and other key actors to deliver more effective policies and investments in sustainable agricultural intensification that strengthen the capacity of poorer farmers, especially women and youth, to access and benefit from Sustainable Agricultural Intensification in Burkina Faso, Ethiopia, Ghana, Malawi, Tanzania and Zambia.
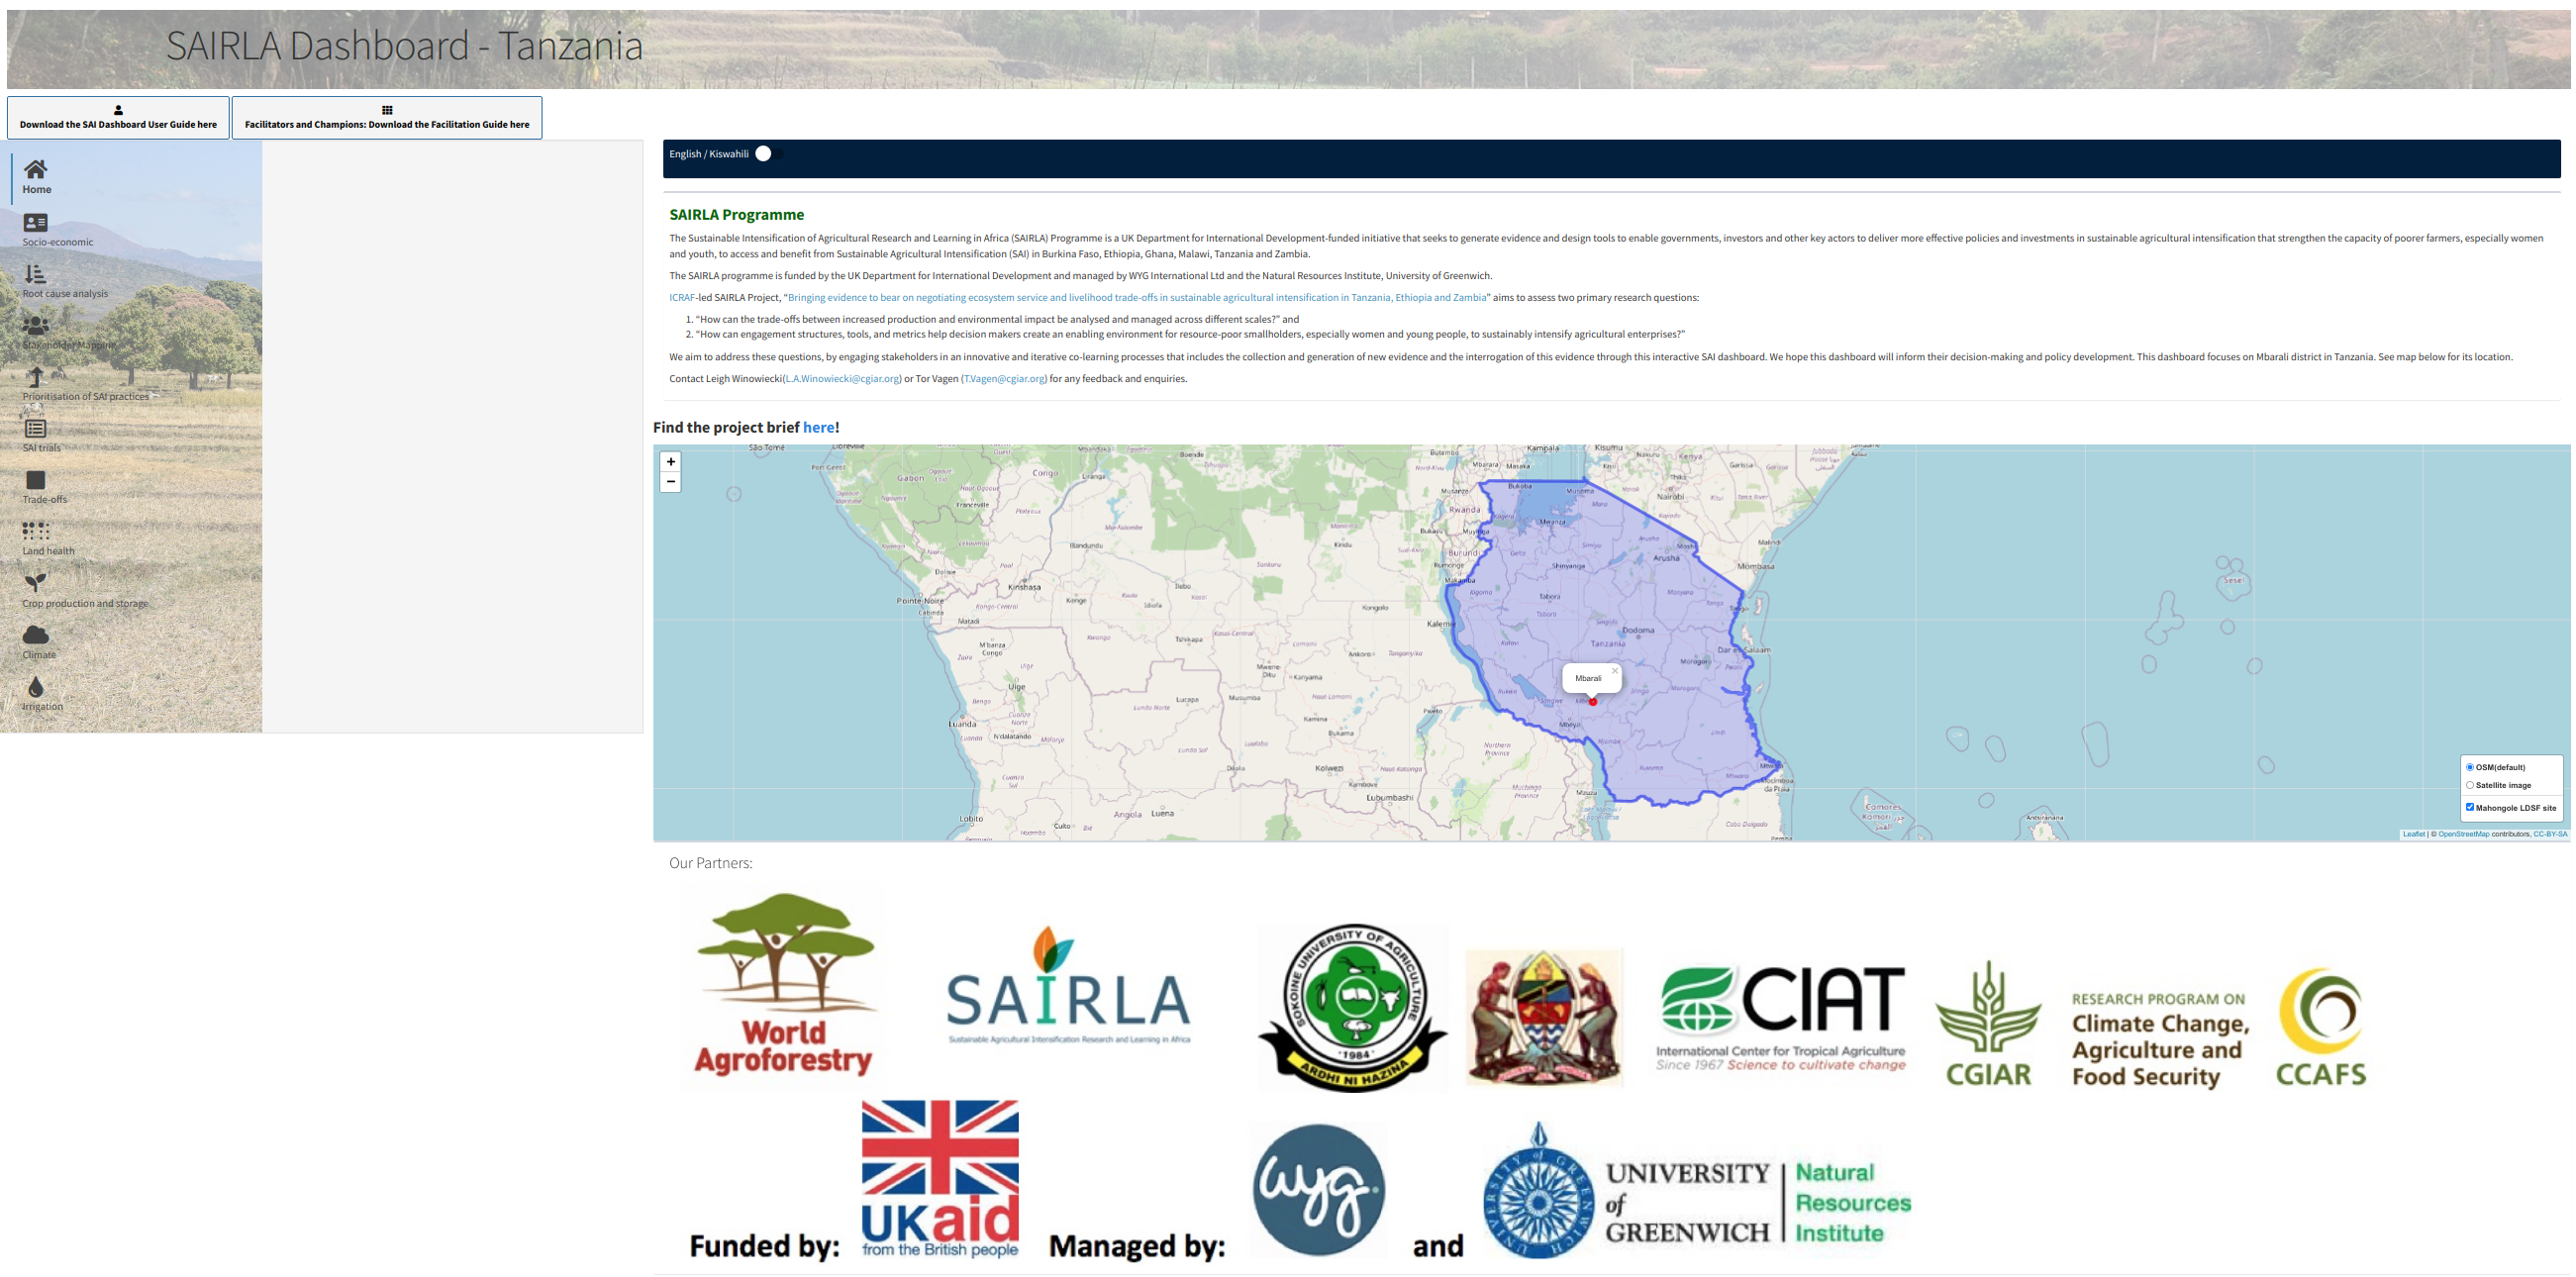
SAIRLA Tanzania dashboard
Interactive SAI(Sustainable Agricultural Intensification) dashboard for Tanzania that was developed under the Sustainable Intensification of Agricutural Research and Learning in Africa program.
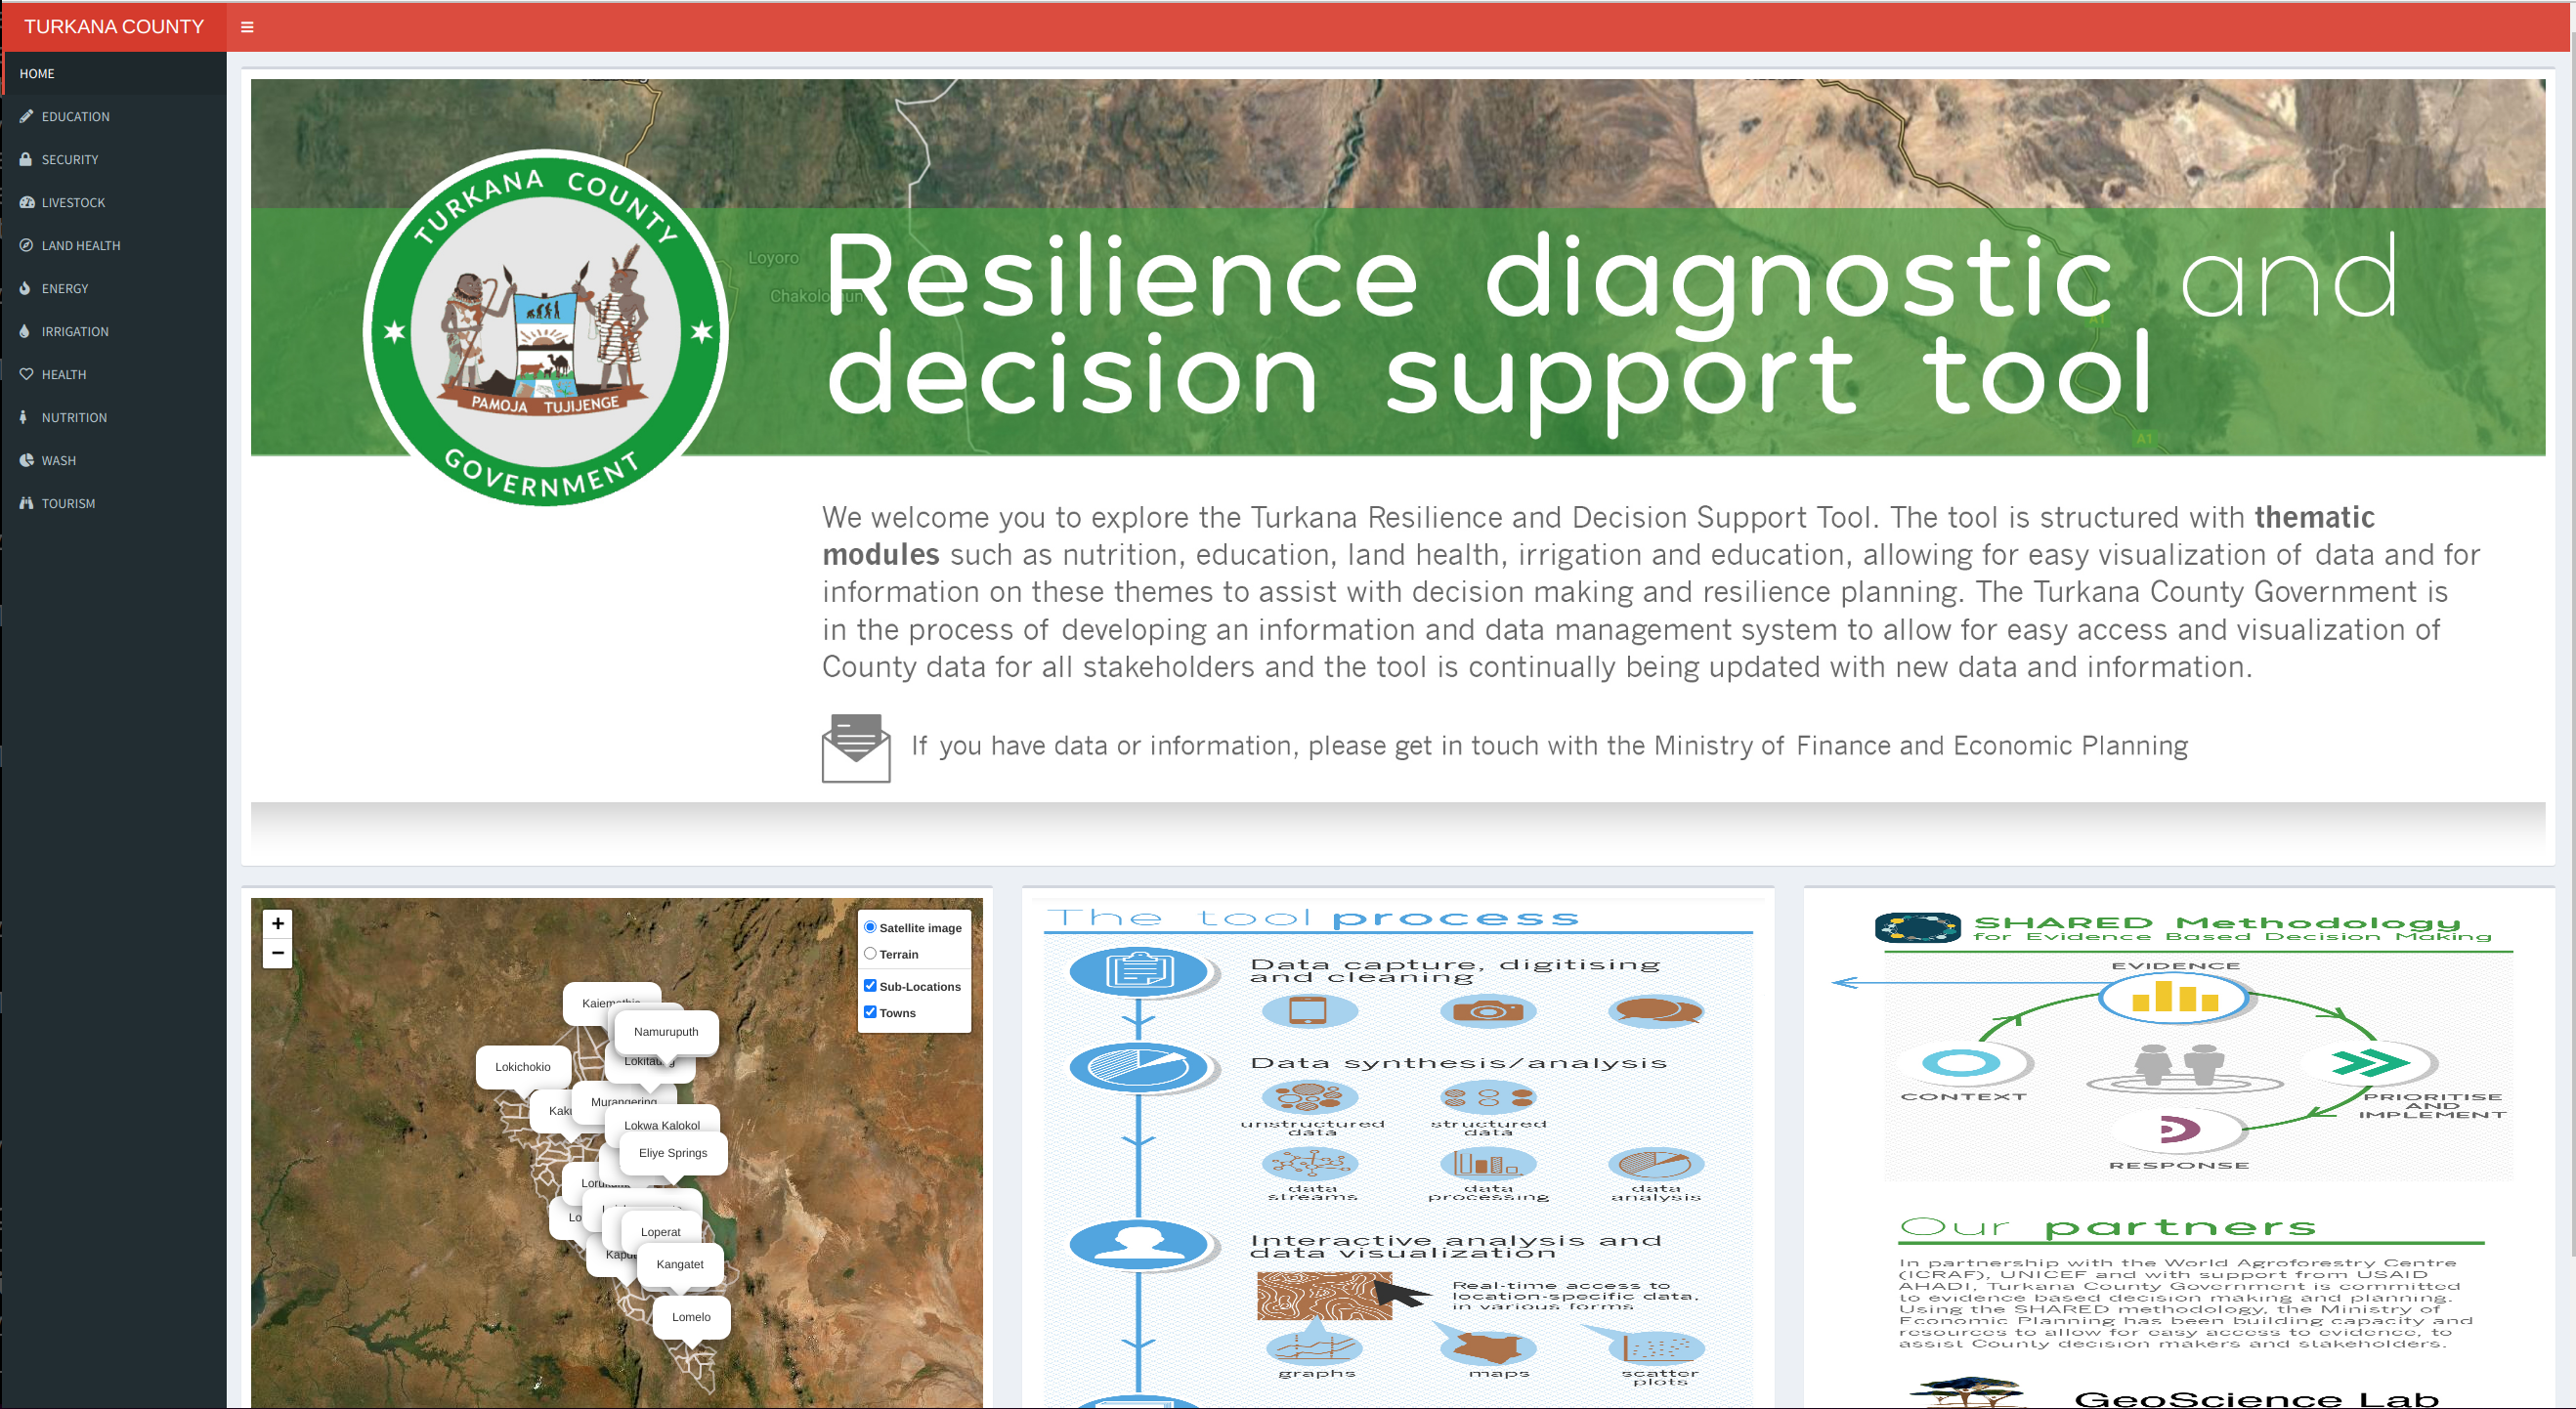
Turkana County dashboard
Turkana County dashboard was developed to support informed decision making at various scales within the County.

Laikipia Resilience Diagnostic Tool
The Laikipia Resilience Diagnostic Tool covers Laikipia County, which is one of the 14 counties within the Rift valley region in Kenya. The tool provides a platform for County officials, stakeholders and investors to get insights from the data presented for purposes of decision making.
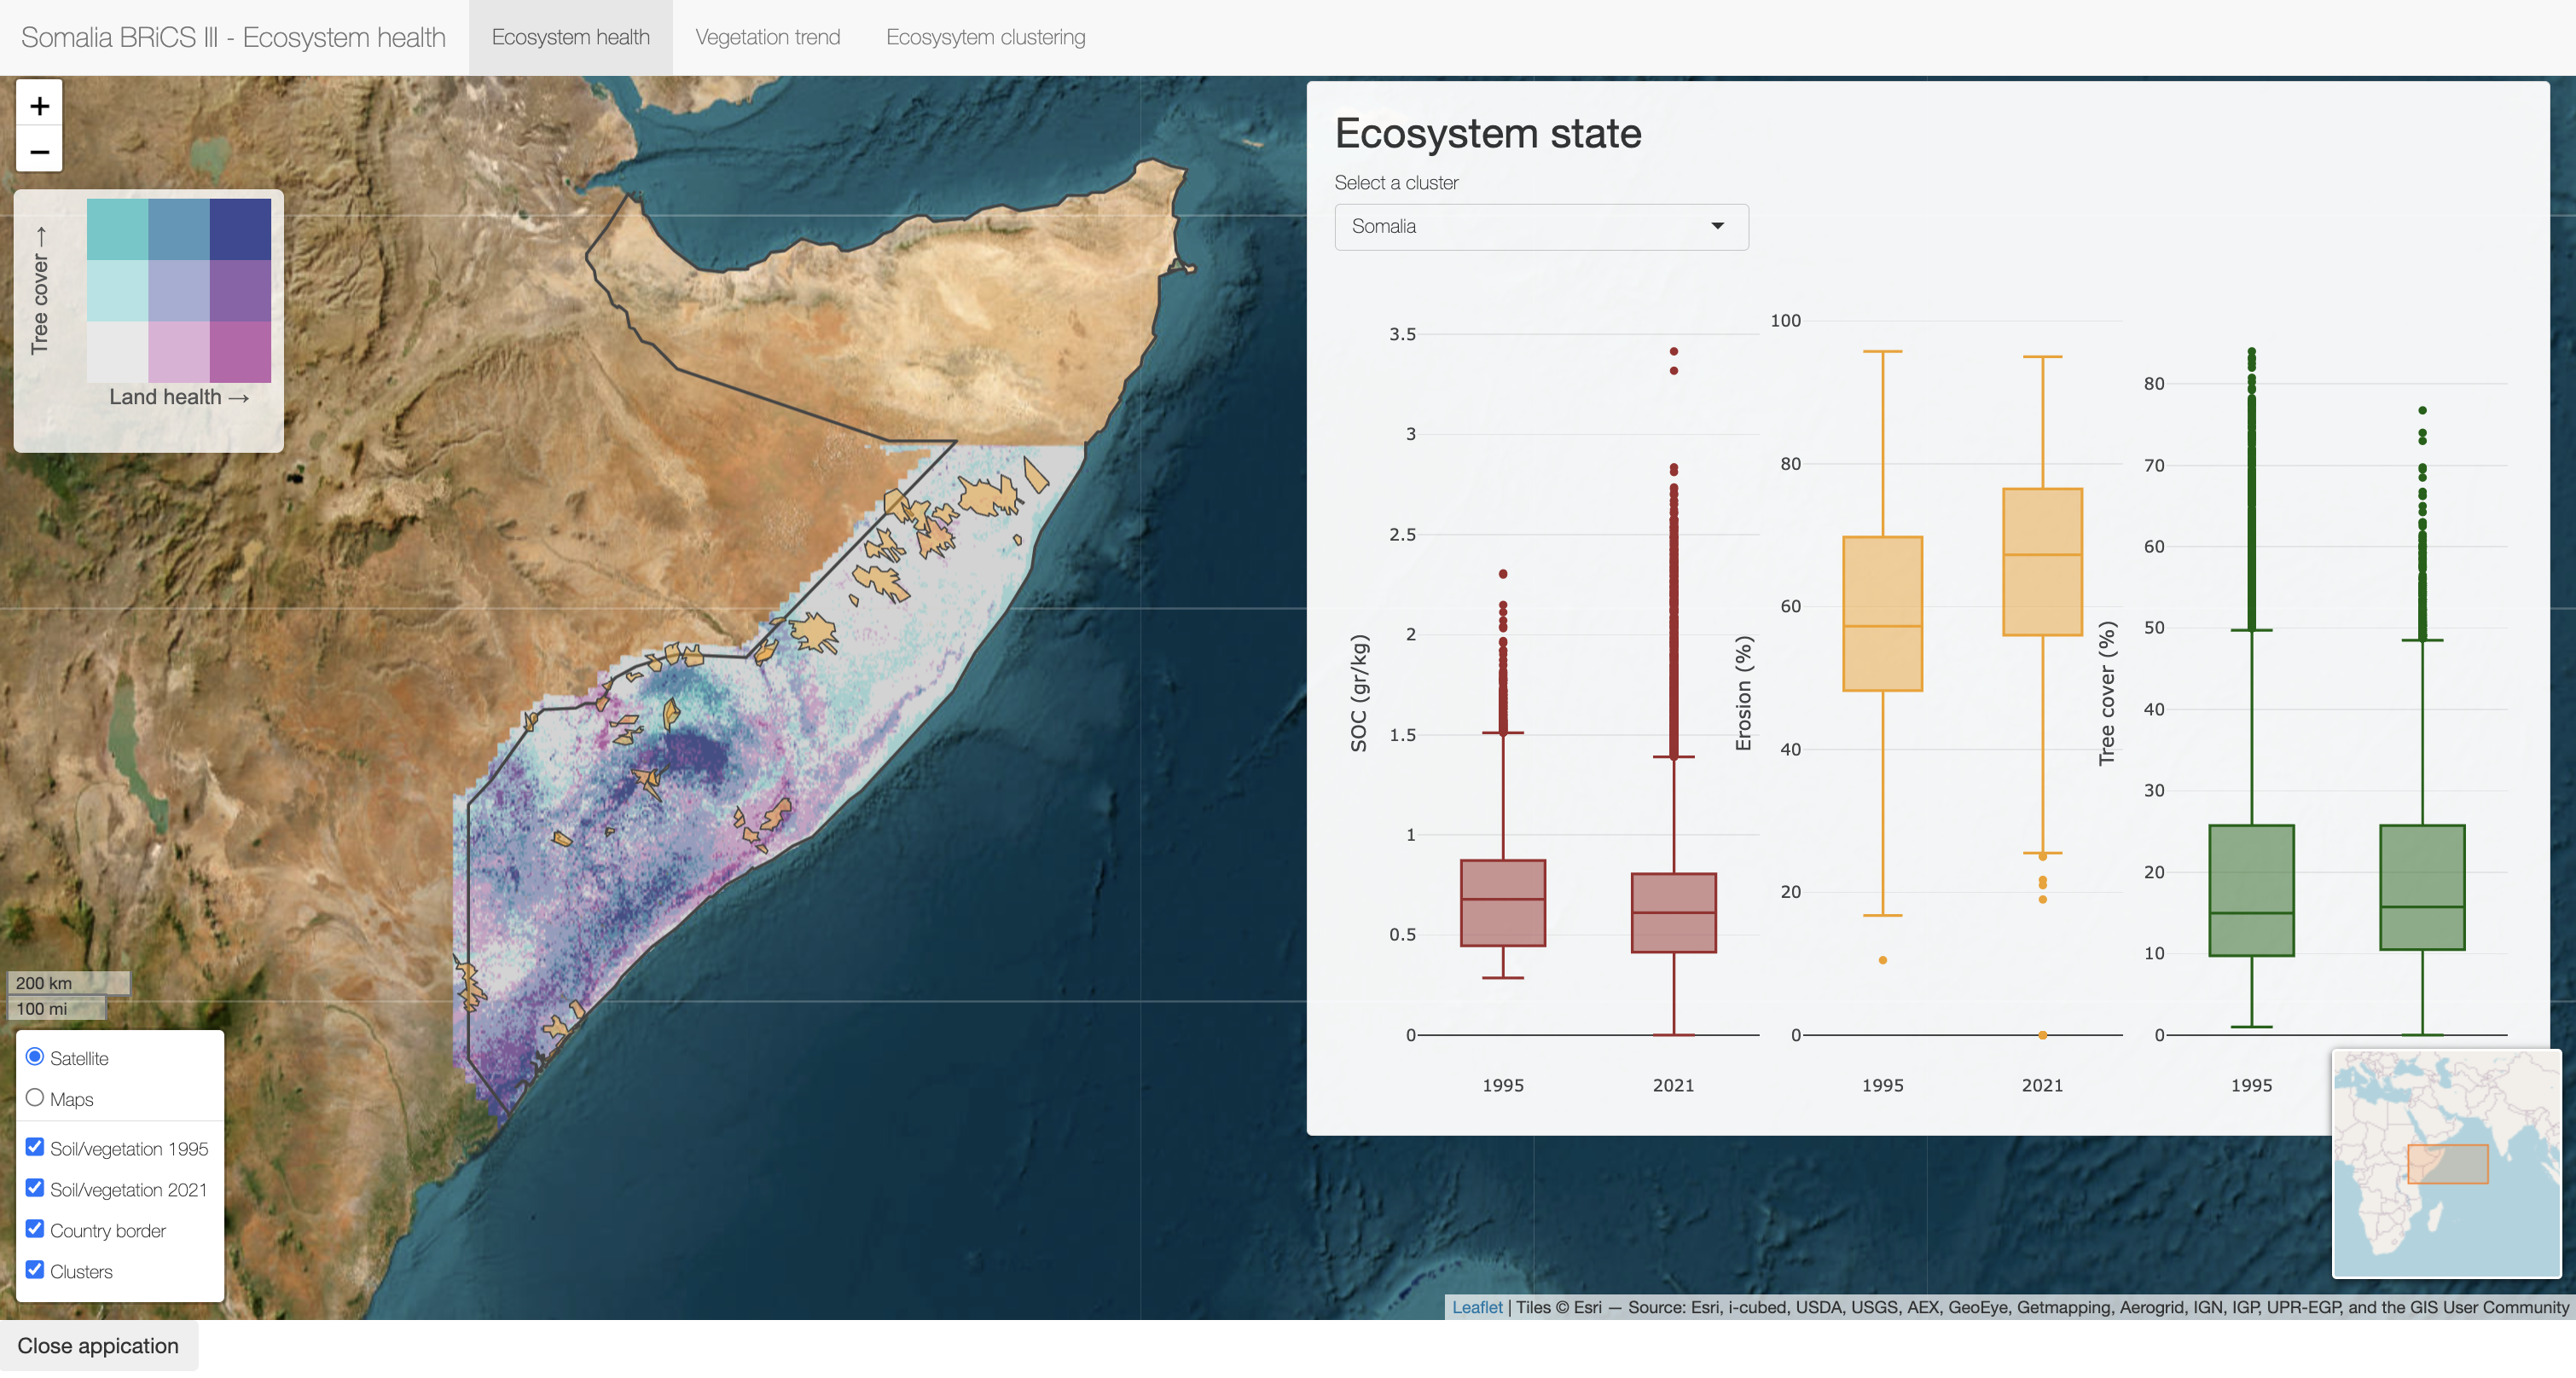
BRCiS III Land Health
Interactive dashboard showing the land health for the BRCiS III project areas in Somalia. It contains an integrated assessment of land and vegetation health across the country, as well as vegetation trends.
